ESCApe data system encompasses instrument control, data acquisition and data processing in a single, easy to use package. With a user-friendly interface and advanced features, our software streamlines the analytical process, saving you time and maximising efficiency. It’s the latest generation of software for use with AXIS Supra+ and AXIS Nova photoelectron spectrometers.
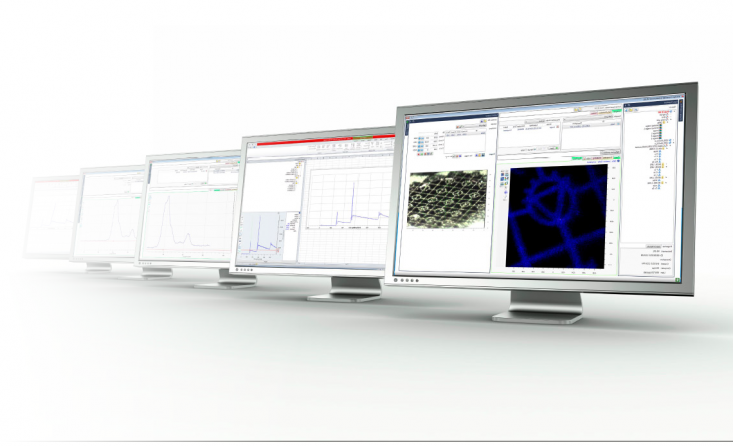
ESCApe data system – seamless integration of software and hardware
ESCApe software exploits the benefits of the highly automated hardware of the AXIS spectrometers with the use of simple workflow methods. We have ensured that the software is intuitive and easy to use. Novice Users are able to acquire data easily using standard methods, whilst expert Users have flexibility to define complex experiments using the extensive capabilities of the spectrometer.
Sample analysis workflow is defined in 3 simple steps:
Step 1 : identification of analysis position from the fully integrated optical sample navigation cameras.
Step 2 : choose the analysis required from one of the pre-defined methods.
Step 3 : submit the method to the queue, starting the acquisition.
These simple steps are repeated for samples on any of the 3 sample holders that may be introduced into the AXIS spectrometer. Where analysis is defined from samples on different sample holders they will be exchanged as part of the automated workflow, enabling the high throughput capability of the spectrometer.
ESCApe data system for acquisition & processing
ESCApe software has been developed in close collaboration with our Users. We understand that it is the interface between the User and spectrometer. Removing Users’ pain-points from the workflow ensures that using a modern AXIS spectrometer is as simple as possible.
Incorporating acquisition and processing capabilities within the same software blurs the distinction between the two functionalities. As we move into the age of artificial intelligence, ESCApe software is well placed to allow acquired data to inform further acquisition steps.
Supporting additional analytical techniques
Additional analytical techniques complement the surface chemical information provided by XPS. ESCApe software supports acquisition and data processing of most additional techniques available for the AXIS spectrometers.
Using optional excitation sources, such as the HAXPES high energy Ag Lα X-rays or low energy UV He discharge is as simple as selecting the appropriate acquisition method. Seamless integration of these additional techniques ensures that they can be easily used, removing the barriers of complexity often associated with secondary analytical techniques.
Auger electron spectroscopy, scanning Auger microscopy and scanning electron microscopy are supported by ESCApe. Coincidence of the XPS and Auger analysis extends the useful information that can be derived from a sample. The significantly smaller probe size provided by Auger analysis allows surface analysis of regions of interest too small to analyse with XPS.
ESCApe software also integrates a number of data processing capabilities required for data reduction specific to optionall techniques.
Configuration options
Whilst ease of use and simplicity are extremely important, we understand that there are times when complete, manual control of the spectrometer is a requirement.
ESCApe software can be configured with hierarchical User access. With full access, manual mode provides access to direct control, instrument tuning and instrument configuration environments. There is also comprehensive component parameter logging allowing interrogation of key operating parameters instantaneously and over extended periods. This capability also provides valuable insight into preventative maintenance intervention and allows remote engineer support and fault finding.
In acquisition queue mode, the instrument status window provides clear, visual confirmation that the instrument is operational. Similarly a vacuum mimic diagram reports real-time status of vacuum components, including values and pumps.
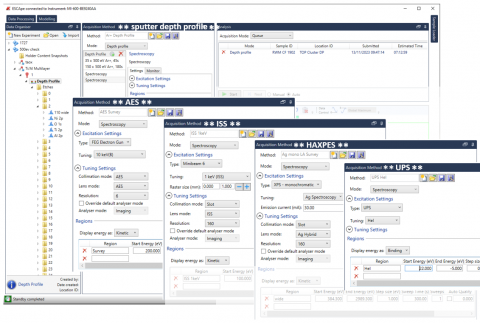
A strength of the ESCape software is the level of automation. Confidence in unattended acquisition means that the spectrometer can perform extended analysis across numerous samples.
Ambiguity of elemental identification has been removed by development of a robust peak-ID algorithm. Peak-ID also extends to spectra generated in HAXPES mode, using the Ag Lα excitation source.
ESCApe takes automated sample analysis to a new level through Data Dependent Acquisition (DDA). This automation incorporates data processing into experimental methods freeing the analyst from the more routine aspects of data acquisition. Sample analysis height is optimised from the position defined on the optical microscope images prior to acquisition of a survey spectrum acquired in highest sensitivity mode. Subsequently the survey spectrum is automatically processed to identify the elements present and their concentrations. This information is then used to determine the regions for high resolution analysis and subsequent chemical state determination.
The quantification routine includes a measure of the error in the atomic concentration. High resolution regions can be acquired to a specified signal to noise ratio. Using DDA you can be confident of producing exceptional quality data.
ESCApe data processing
ESCApe software provides a comprehensive toolkit for data processing. We’ve automated peak-ID and survey spectrum quantification. Powerful data reduction routines allow the User to fit complex models to spectral envelopes.
Data reduction can be simplified by dropping a saved model onto an unprocessed spectrum. A linear least squares fit is applied to optimise the fit of the model to the acquired data.
Extraction of depth distribution information from angle-resolved XPS analysis is achieved using Kratos developed maximum entropy method software embedded within ESCApe.
ESCApe data processing extends to imaging data, with easy generation of quantitative XPS images. Post-acquisition spectral generation from spectromicroscopy data is seamlessly displayed, providing an innovative approach to determining lateral distribution of surface chemistry.
Array analysis is an exciting way of acquiring and visualising large dataset information in a correlative way.
With some samples, elemental or chemical distribution may not be homogeneous across the surface. Differences may exist over extended areas of the sample. By submitting an array analysis data can be acquired from discrete positions across the sample. Spectra are quantified and the information displayed graphically as an overlay on the optical image. This simple approach to large dataset acquisition and display allows easy identification of regions of interest or correlation between elemental/chemical distribution across the sample.
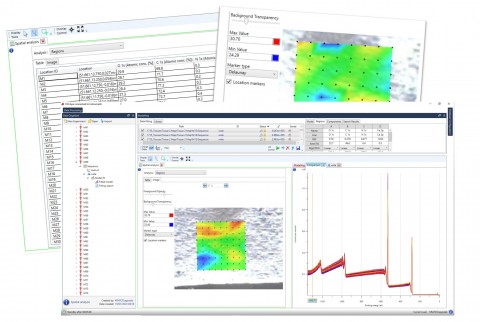
Once data reduction is complete, it’s important to be able to distribute the results. ESCApe software offers a number of useful output options.
An Excel add-in allows experimental datasets to be opened with the same tree structure used within ESCApe software. A complete description of the spectrum, curve fits, envelope background and transmission function are available within Excel. Batch output for multiple spectra is possible.
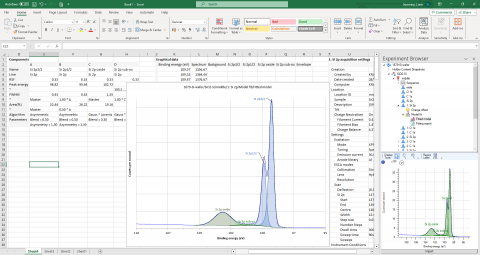
Data is also transferable using the VAMAS format, making it compatible with CasaXPS.
